Equity & Market Scanners
Build stock screening systems using client-defined price, volume, indicator, trend, breakout or other technical conditions.
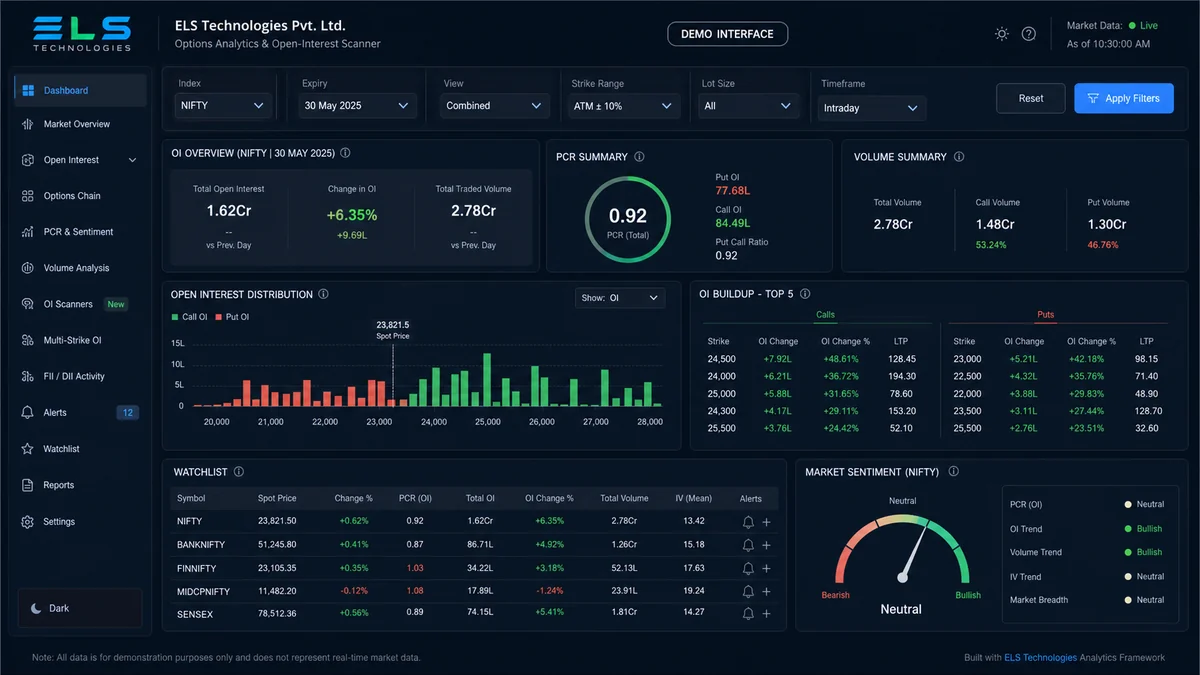
ELS Technologies Pvt. Ltd. develops custom market scanners and trading dashboards according to client-defined technical requirements. Projects can include equity screening, derivatives analytics, open interest, PCR, volume, technical indicators, multi-timeframe conditions, support and resistance data, watchlists and real-time operational dashboards.
Custom scanner software can organize technical and market-data conditions into clear monitoring views according to the client's exact specification.
Build stock screening systems using client-defined price, volume, indicator, trend, breakout or other technical conditions.
Develop dashboards for available options data such as open interest, PCR, strike-level information and other project-defined derivatives analytics.
Display and evaluate specified technical conditions across multiple timeframes in one structured software interface.
Create responsive dashboards combining scanner results, indicators, watchlists, market metrics and project-specific monitoring panels.
Scanner and dashboard modules can be selected according to the client's use case, available market data and technical requirements.
Screen instruments using client-defined price behaviour, ranges, breakout or breakdown conditions.
Use specified indicator conditions such as EMA, RSI, MACD or other technically defined calculations.
Monitor project-defined volume conditions, relative volume or other data-derived volume metrics.
Display available strike-level or aggregated OI information where supported by the selected data source.
Calculate and present client-required options metrics using available market-data inputs.
Display support, resistance or other project-defined analytical levels derived from specified rules.
Organize scanner matches into usable watchlists, filtered groups and operational monitoring views.
Combine scanner results and selected analytics into responsive desktop or web-based interfaces.
The scanner processes available data according to defined technical rules and displays the resulting information in a usable interface.
Depending on the requirement, a project can combine equity screening, options analytics, indicator status, timeframe comparisons, watchlists and other client-defined monitoring components.
ELS Technologies Pvt. Ltd. develops software according to clearly defined client requirements and technical specifications.
We understand the exact workflow, rules and expected software behaviour.
The initial logic, interface or system direction is prepared for review.
The approved requirement is developed into controlled software modules.
The system is verified against the agreed technical requirement before delivery.
Yes. Scanner logic is developed from clearly defined client requirements such as indicator conditions, price behaviour, volume rules, timeframe combinations or other technical filters.
Yes, where suitable market-data access is available. The exact information depends on the data source, API permissions and project requirements.
No. Scanner outputs are software-generated results based on client-defined conditions and available data. ELS Technologies does not provide investment recommendations, trading calls or profit guarantees.
ELS Technologies Pvt. Ltd. provides software and technology development services. We do not provide investment advisory, research recommendations, trading calls, assured returns or profit guarantees.